


Описание | База данных событий СКЛ | Вероятностная модель СКЛ
This database contains Solar Energetic Particles(SEP) fluences, measured from august 1997 till 2006 with the instruments on the satellites GOES and ACE. In this period we selected 56 SEP events and determined the proton and He-ion fluences by GOES spacecrafts (Telescope and DOME instruments), C, N, O, Ne, Mg, Si, S and Fe fluences by ACE spacecraft (SIS instrument).
 The quantitative probabilistic model of the solar energetic particle fluxes description
1. Database
1.1 Protons and He-ions by GOES spacecrafts data (Telescope and DOME instruments) are selected from:
http://ngdc.noaa.gov/stp/
http://spidr.ngdc.noaa.gov/spidr/
1.2 High-energy heavy ions (Z = 6, 7, 8, 10, 12, 14, 16, and 26) by ACE spacecraft (SIS instrument) data are selected from:
http://www.srl.caltech.edu/ACE/ace_mission.html
Database is interpreted and composed by Dr. phys. and math. R. Nymmik /Skobeltsyn Institute og Nuclear Physics, Lomonosov Moscow State University/
Webpage is composed by A. Sobkanyuk /Lomonosov Moscow State University/
2. Probalistic quantitative model of fluences and peak fluxes of SEP particles
Developed and programmed by Dr. phys. and math. R. Nymmik /Skobeltsyn Institute og Nuclear Physics, Lomonosov Moscow State University/
Server application is composed by A. Sobkanyuk /Lomonosov Moscow State University/
Solar Energetic Particle events composition database
The event selectionThe SEP events were selected by GOES-8 4th channel (15-40 MeV) data (see Fig.1). By given data was determined the 24 hour time period with a maximum proton flux. The fluxes of another particles were determined in the same time period. For the particle fluence determination the 24 1-hour fluxes from Internet databases were summarized. 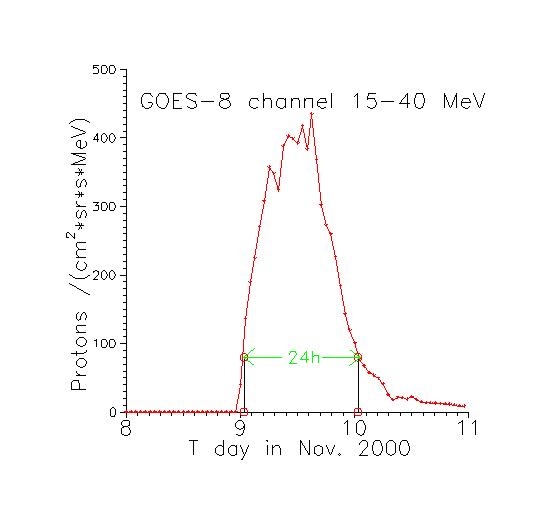
Fig. 1. The proton fluxes measured by GOES-8 instrument in energy channel 15-40 MeV from 8 to 11 Nov. 2000. The 24 hour maximum particle flux interval selected, is shown. The energy spectra, determined from experimental data.
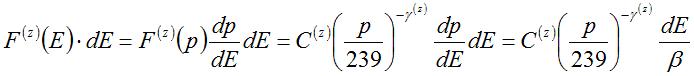
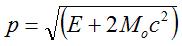
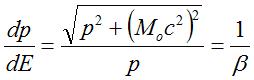
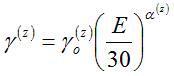
The all energy spectra are given as power function of the particle momentum (per nucleon):
In case of E=30 MeV/nucleon γ(z)=γo(z) and if E < 30 MeV/nucl -
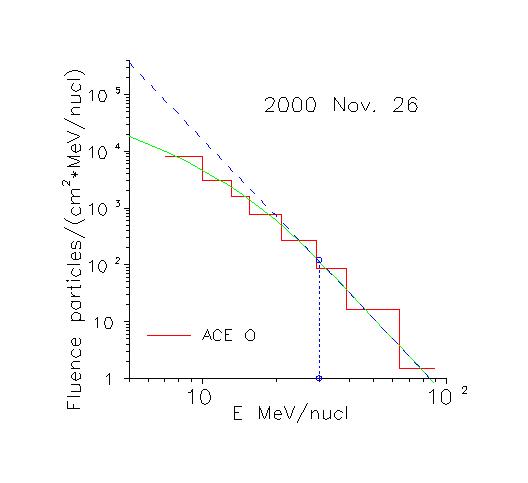
So, every spectrum is determined by 3 parameters: C(z) - spectral coefficient, γo(z) – spectral index and a(z) - droop index. On the Fig. 2 the Oxygen fluences and the corresponding energy spectra for the SEP event from 8 Nov. 2000 are demonstrated. At E=30 MeV/nucleon the spectrum is power law from particle momentum (per nucleon) with the spectral index γo(O)=8.0. At the E < 30 MeV/nucleon the spectrum droops according to the droop index α(O)=0.30 value. At the E=30 MeV/nucleon the particle fluence is F(30)=C(O)/ß, where C=28.6 and ß=0.25.
The database content
The database contents data of 56 SEP events. The data are systematized by the 6 numbers code:
000000.
|
 and
and
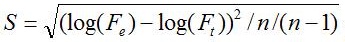 where n is the number of measurement channels.